
We really like to show off our users incredible work – especially if they are publishing papers using Mind the Graph illustrations and tools.
So, today we’ll show you the research of a premium user at the mind the graph, Stefania Forner. Her review article was recently published in Trends in Neurosciences entitled Synaptic impairment in Alzheimer’s Disease: A dysregulated symphony. She made two Alzheimer’s graphical abstracts to illustrate her work.
First, let’s begin with a little introduction of Stefania studying field:
Alzheimer disease (AD) is a neurodegenerative disorder that causes cognitive deficits and memory loss. AD is the sixth leading cause of death in the USA and affects 35 million people around the world.
Evidence suggests that there is a causal role between the cognitive deficits of AD and synapse loss. Also, synapse dysfunction may are related to two pathological pathway. An extracellular accumulation of beta-amyloid peptide and intracellular accumulation of tau protein.
These two process are known to play an important role in AD. However, one of the major fundamental questions that remains is related to the molecular relationship between beta-amyloid and tau, and how these two players interdependently cause impairments in synaptic function in AD.
So, to analyse separately tau protein and beta-amyloid peptide effects in synaptic function and AD, Stefania used two graphical abstracts she made at Mind the Graph platform. One to show the formation of beta-amyloid oligomers and their mechanisms of synaptic toxicity and other to show the relation between tau protein and synapses in neurons.
Alzheimer’s graphical abstracts

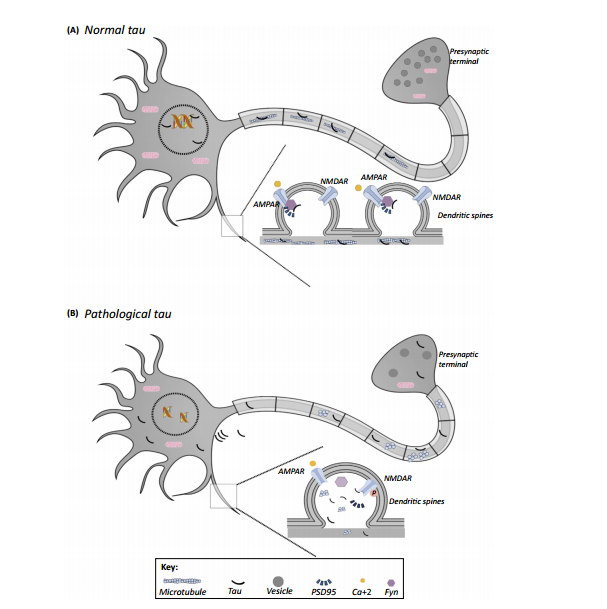
“Notably, studies investigating the molecular relationship between Aß, tau and synaptic deficits and/or loss, have shed light on how these pathologies could ultimately lead to cognitive decline in patients. The identification of several potential pre- and postsynaptic pathways may contribute to the underlying clinical symptoms of AD.”
I want graphical abstracts to my research too!
Graphical abstracts are a way to complement and illustrate main points of your work. If you want to learn about how to make amazing graphical abstracts of your own, here are a couple posts to help you:
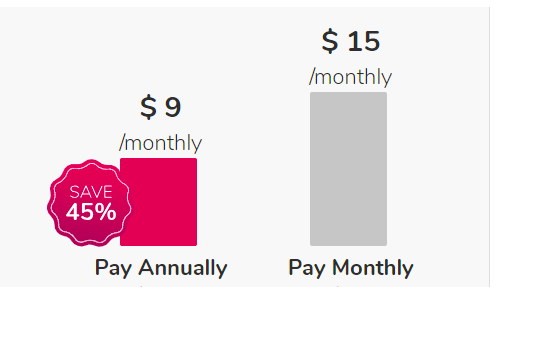
You can start using Mind the Graph for free. We have a Free version in which you can give it a try and access our scientific library. Premium users have full access to the platform and special benefits as you can see here.


Subscribe to our newsletter
Exclusive high quality content about effective visual
communication in science.
