Hello there. Are you ready to see the best scientific illustrations of the week? As you know, every week we add illustrations that become available to mind the graph users (free users included). If you liked them, you can save in your personal library to keep them just one click away. We also publish the best scientific illustrations of the week on our blog to keep you updated.
Besides that, if you miss an illustration, you can request to us.
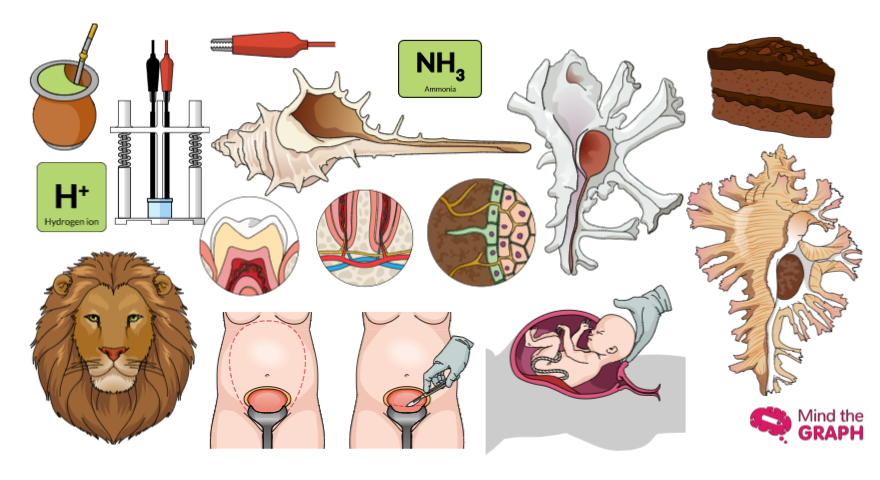
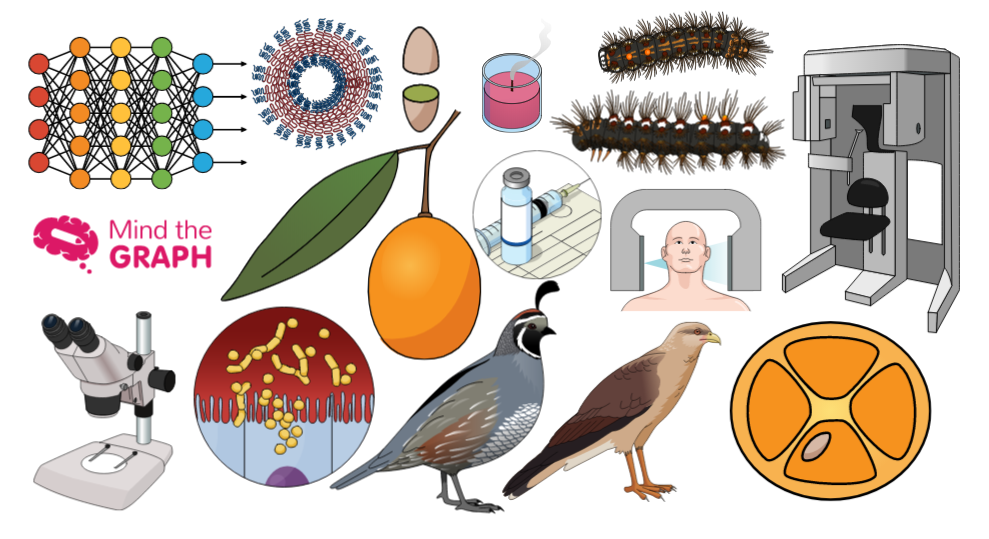
Lab equipments:
We have an entire category with illustrations of lab equipments. These illustrations below are the last we added, but you can check all them on mind the graph:

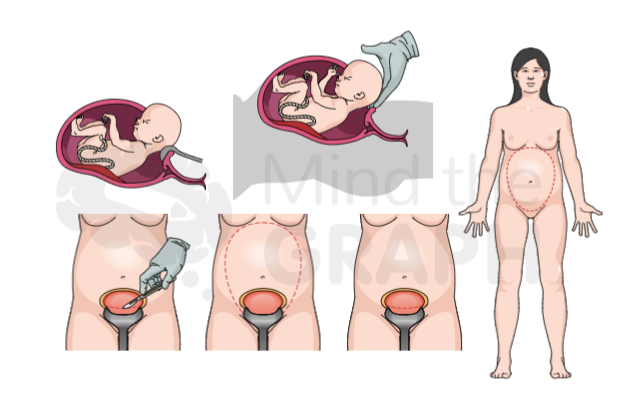
Obstetric procedures and C-section
We also added new illustrations to our ginecology and pediatry categories.
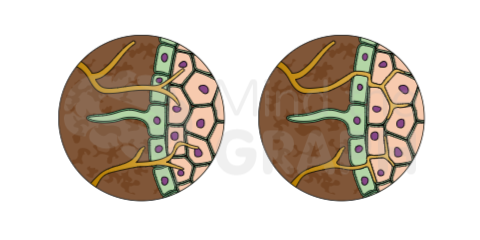
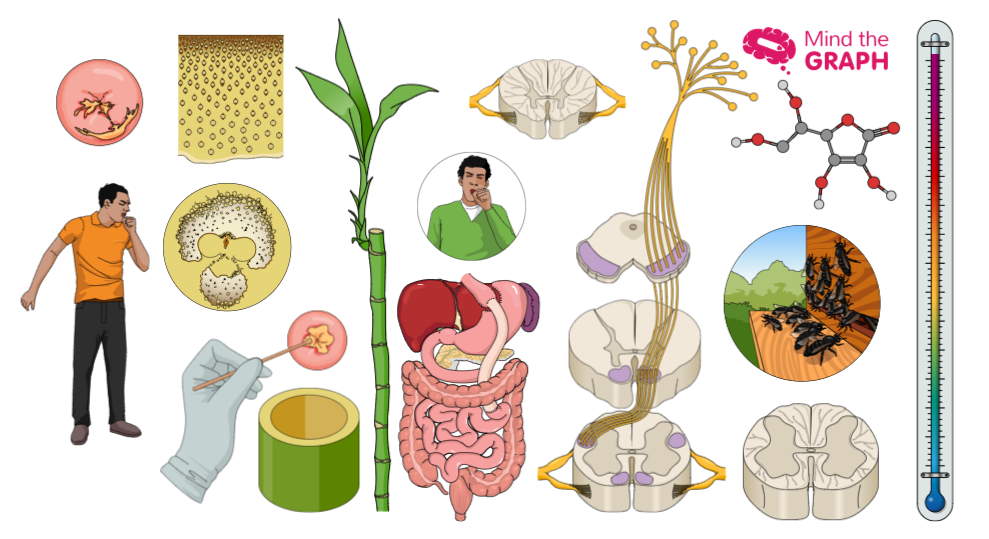
Endomycorrizhae
We already have illustrations of ectomycorrizhae. So, now we created illustrations to show the differences between these two symbiotic process. Unlike ectomycorrhizae which form a system of hyphae that grow around the cells of the root, the hyphae of the endomycorrhizae not only grow inside the root of the plant but penetrate the root cell walls and become enclosed in the cell membrane as well. This makes for a more invasive symbiotic relationship between the fungi and the plant. You can check the ther mycorrizhae illustrations here.
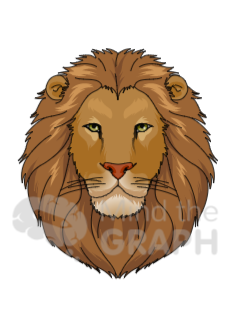
Lion face
The new lion king movie was a success around the world. So we felt inspired to create a new illustration:
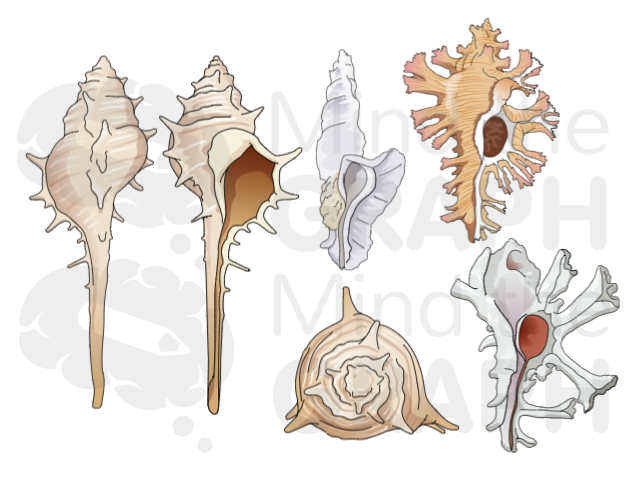
Mollusks
These beautiful shells belong to the mollusks Murex, Pterynotus, Chicoreus and Homalocantha.
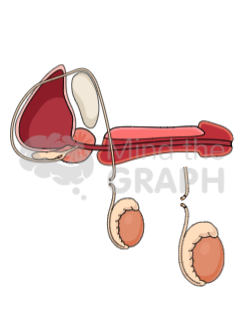
Vasectomy
We already have illustrations of human male reproductive system, but now there are specific illustrations of vasectomy, a surgical procedure for male sterilization or permanent contraception.
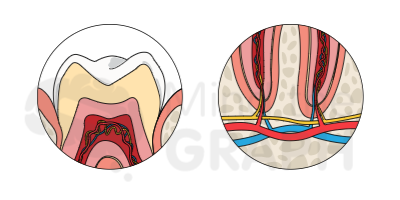
Teeth anatomy
New illustrations of odontology. Now you can see in details the teeth innervation.
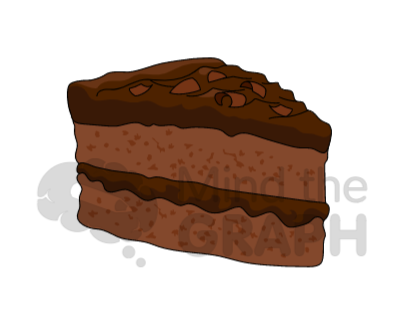
Chocolate cake
This chocolate cake is in the nutrition category. And honestly, this is my favourite illustration of the week for obvious reasons. Unfortunately you can only visualize it, but don’t hate me. If you felt the same way, this link will be helpful.
Can I use these illustrations on my publications?
Yes. Mind the graph is an online DIY platform to allow scientists create their own graphical abstracts, presentations and infographics. In fact, we have the largest library of scientific illustrations online. To begin with, you can create a free account and start creating you own images. So you can use mind the graph to choose the best scientific illustrations for you and combine them in your graphical abstract. You can stay as a free user as long as you want. However if you want to have access to all features you can upgrade to an unlimited account.


Subscribe to our newsletter
Exclusive high quality content about effective visual
communication in science.
