The Mind the Graph platform isn’t only to create scientific infographics to articles. You also can create presentations for conferences, events or classes. Once your presentation is ready, share the link or present directly from platform. Today, I’ll show you some available features to make your day more practical.
Some these features are available only for premium users. If you want to access all resources of the platform, by a really low price, you can upgrade to a researcher account (USD 15 per month or USD 9 per month for the annual subscription).
Edit and share your profile
You can add professional information in your profile. Also, is where other people can visualize all your public presentations. So, create a portfolio with Mind the Graph and share your profile link to divulge it.
It’s possible to choose public or private mode for your creations, if you are a premium user. All creations of free users are in public mode.
Create presentations in public mode
Public creations can be seen by other people, which means, you can share the link in social media or send by e-mail to show your work to co-workers and friends. If you choose the private mode, only you can see your creation.
To change privacy settings go to my creations and choose the best option for you:
Change the description of your images
You should change the title, description and tags to get your infographic or slides indexed on google images search. You can improve your authority on your field of study, so when other people search for images on google, with keywords that you used to describe your figure, they’ll find your work.
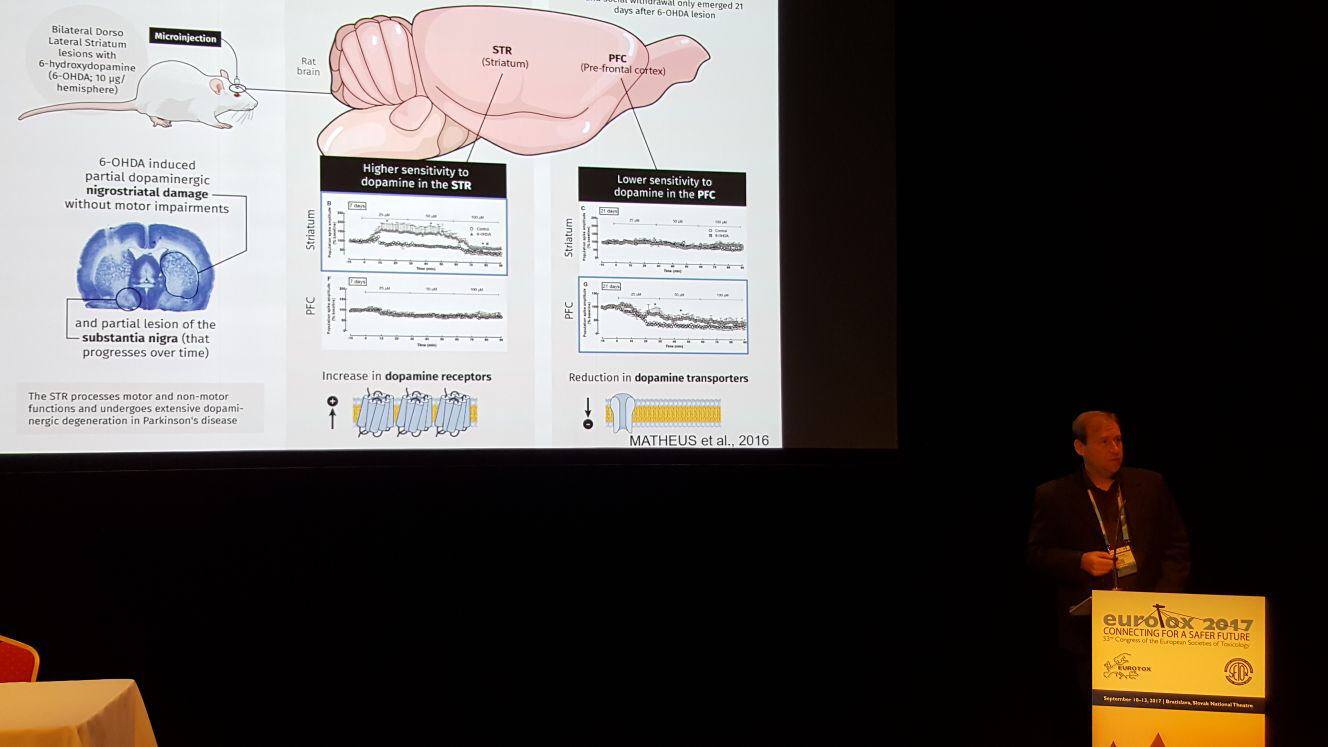
Time to present your work
Using just one platform you create your slides and present them in full screen:
If you want to use the Mind the Graph platform and see how it works, start now for free and see how your routine can be more practical.
Also, we are always open to hear feedbacks and inputs on how our platform can get better and better. Write to us: contact@mindthegraph.com

Subscribe to our newsletter
Exclusive high quality content about effective visual
communication in science.
