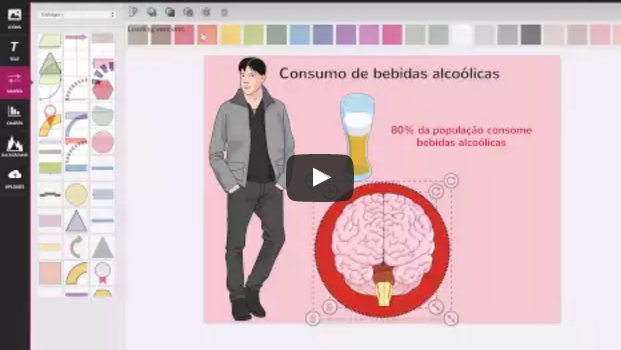
This was a great surprise for us. The blog FCiencias from Portugal, posted a video showing how they created an infographic with the Mind the Graph free infographic maker. They are from the area of health and used some data about alcohol consumption to create an infographic.
You can access the FCiencias post here and the video below shows one of the blog editors using the free infographic maker. Yes, FREE, that’s the best part of it. You can use all the templates and illustrations for free and download your infographic to use where you need.
Source FCIencias -> https://www.youtube.com/watch?v=2a9Ogh5aPKs
Mind the Graph is not the only free infographic maker available, but it’s the only one dedicated to health and life science infographics. If you are a scientistis, or a content creator in any field of biology or medicine, you know how hard is to communicate these topics without having the right illustrations.
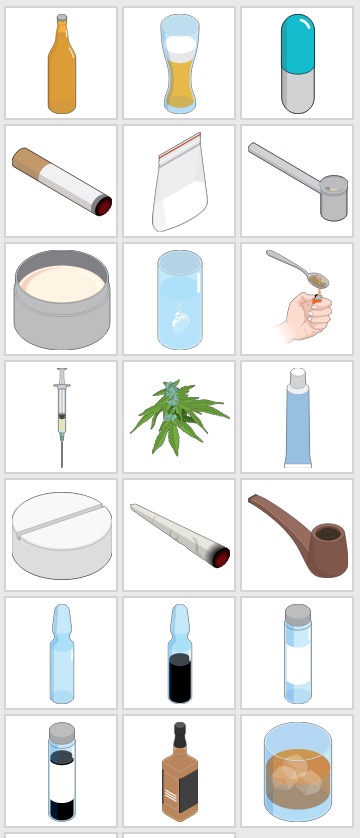
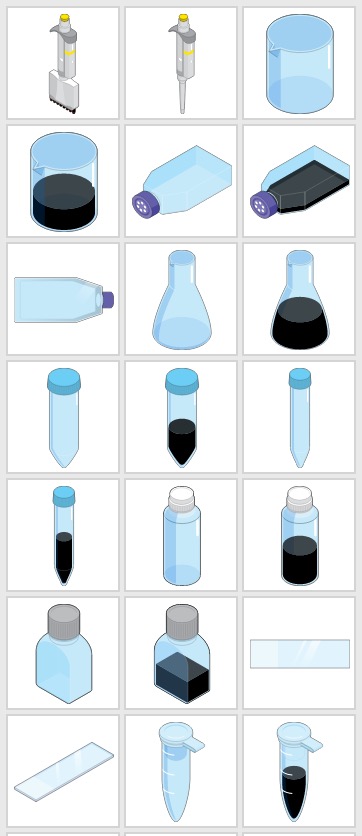
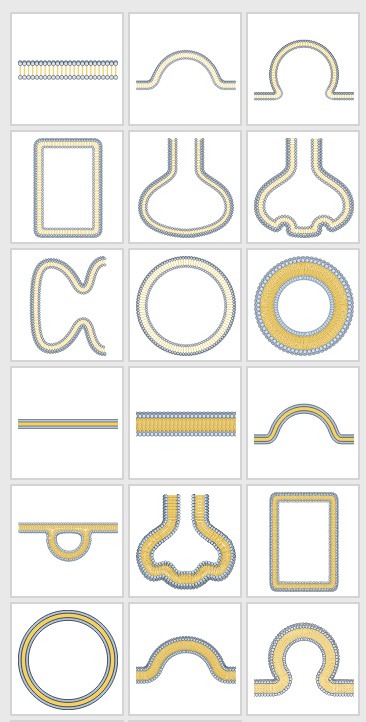
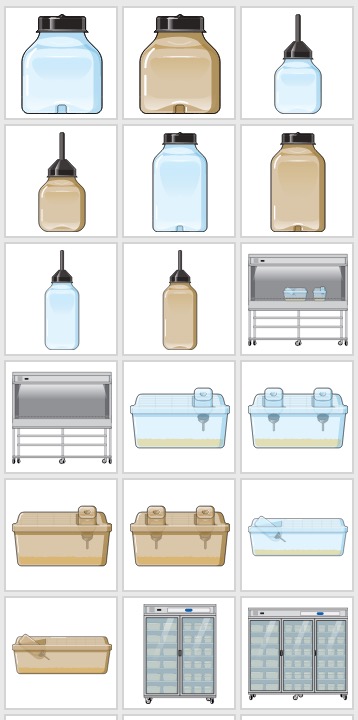
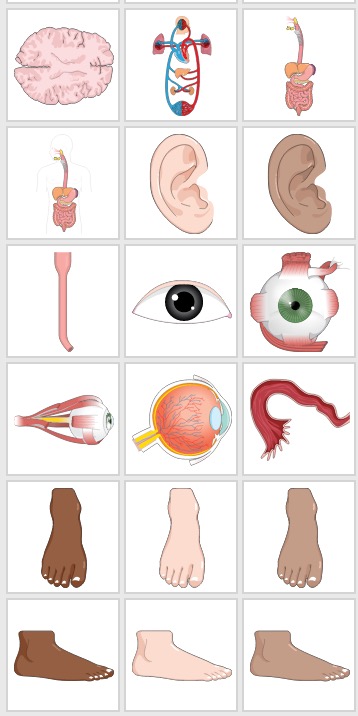
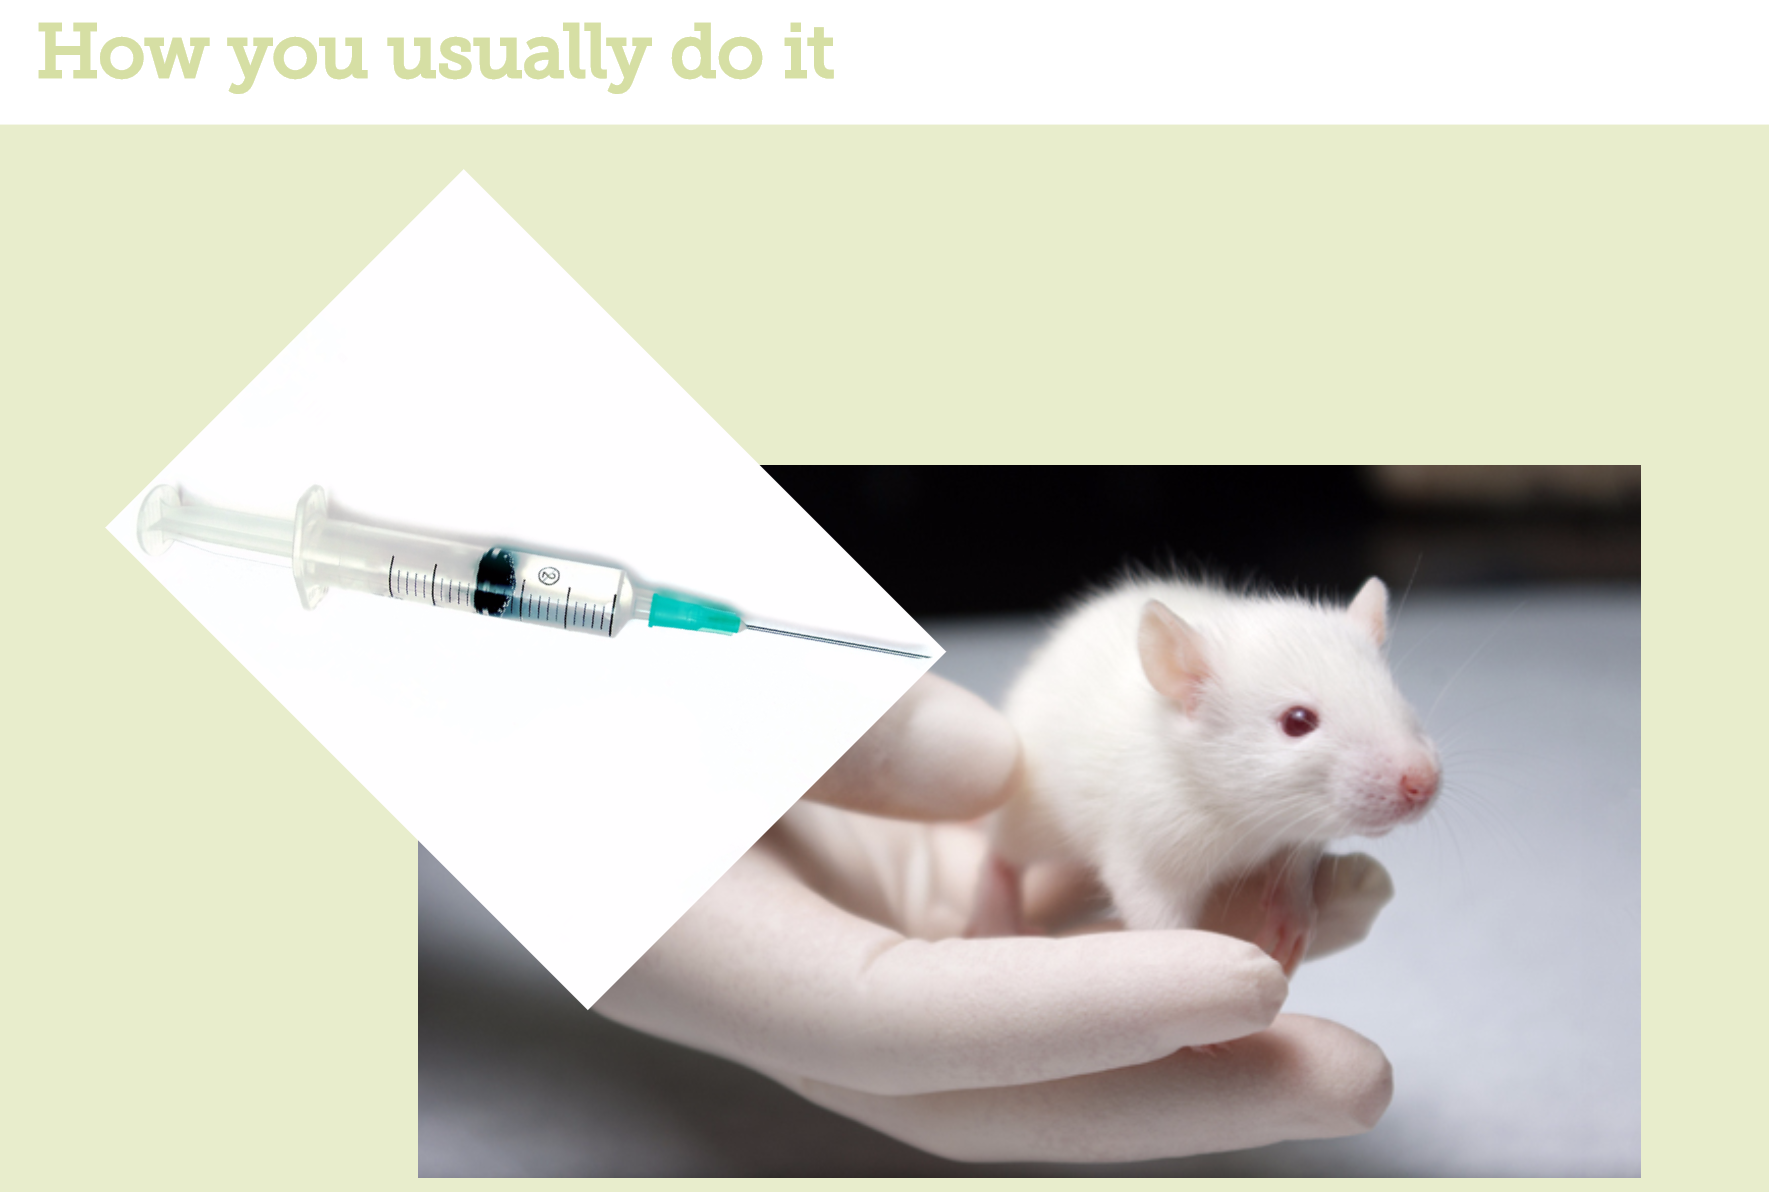
Check a few examples of the illustrations you find in the free infographic maker!
That’s why we created the Mind the Graph free infographic maker, so that you can find exactly what you need to create your infographics. And for free! Try it at www.mindthegraph.com.


Subscribe to our newsletter
Exclusive high quality content about effective visual
communication in science.
