
Graphical abstracts for Springer
After a long time studying and working in a lab you finally got the data to publish your paper. How exciting, right?
If you are in the final steps to publish a new paper you probably noticed that a graphical abstract is mandatory to publish in several scientific magazines. This includes magazines of very popular publishers for research paper publication like Elsevier and Springer.
Springer is a publisher with more than 2,900 journals in different scientific fields. They have guidelines to help scientists interested in publishing a new paper, including a section about graphical abstracts. I used their guidelines to organize this tutorial on how to create a graphical abstract for Springer.
Why should you create a graphical abstract?
Graphical abstracts are a visual representation of the main point of your work, allowing readers to see at a first glance a summarization of your paper and then decide to read it – or not.
In a world where no one has time to waste plus a crescent ocean of information available, you need to be assertive and attractive to reach your audience. After all, you worked very hard to get your results and want to people know about it, right? A graphical abstract is a very good ally in this job. Your creation will appear side by side with the headline and the authors’ name on the homepage.
According to the Springer guidelines, “a Graphical Abstract (GA) is mandatory for all submissions“, and:
“The pictorial representation is intended to attract the attention of the readership. GA illustrates a process or clarifies a specific aspect of the work, ideally an innovation/novelty component. The Graphical abstract should follow the same format guidelines as the figure files, with the exception that it does not require a caption. The GA will be displayed on the online publication venue, but will not appear in-print. The GA cannot be one the manuscript designated Figures.”
Springer Guidelines
Click Here to start using Mind the Graph, the Graphical Abstract Maker
I have heard many scientists complain about the difficulty of creating a visual representation. After all, we are not designers and accurate scientific illustrations are not always easy to find it. But, you know, that’s the reason we created Mind the Graph, right? We want to empower scientists to communicate science visually in an eye-catching way.
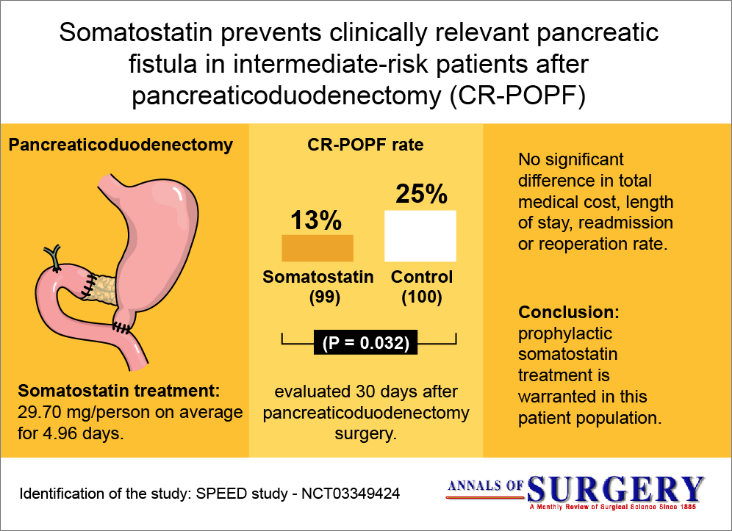
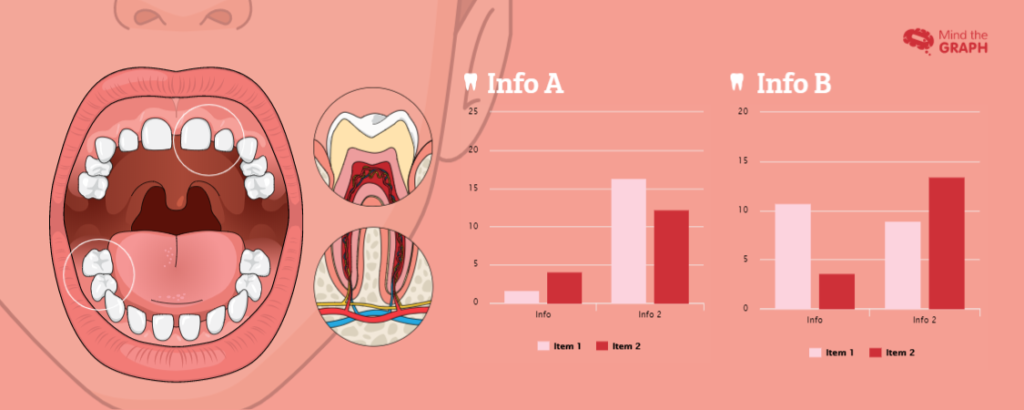
One graphical abstract example created using Mind the Graph templates available to our users:
What I need to know to create my graphical abstract for Springer?
The most important information of your paper.
A graphical abstract exists to summarize the content. Do NOT try to put all your data inside a graphical abstract. It is a decoy, to inform the basic and attract the reader for more information.

Read the guidelines of the magazine you want to publish
For all magazines of the Springer group the guidelines are:
- The GA should be 8 cm (3.15 inches) wide x 4 cm (1.57 inches) high when printed at full scale (100%), and should have high quality image and text. Please insure that the illustration maintains this aspect ratio and is still informative upon reduction.
To the size 8 cm (3.15 inches) wide x 4 cm (1.57 inches) you need to set your creation to 500X250 pixels or more. At Mind the graph you can use up to 1500×750 pixels in the graphical abstract format.
- The figure should be in one of the following file types: .tiff, .eps, .jpg, .bmp, .doc, or .pdf. For “rastered” images (.pdf, .doc, .bmp, .jpg), the resolution should be at least 300 dpi.
On Mind the Graph you are able to download in pdf, tiff, and png formats at 300dpi (high resolution).
- Include a short title and description (about 50 words).
The idea of a graphical abstract is to show your data in a visual way, so the focus must be on illustrations, charts, and other visual elements. The text is a secondary element to help the understanding.
Click Here to start using Mind the Graph, the Graphical Abstract Maker
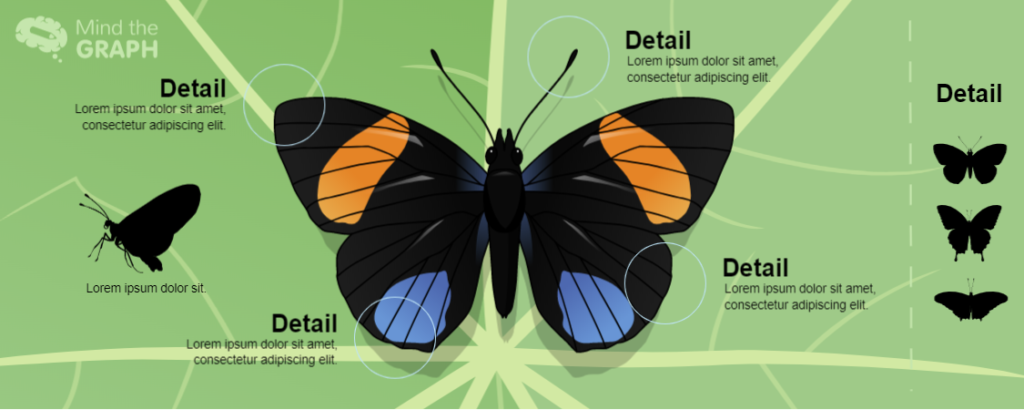
Patterned and beautiful illustrations add value to your work.
Well, after years of doing research and getting results it is time to publish. The images and illustrations should be on the same level as your research. Otherwise, it can give an unprofessional to your paper.
Mind the Graph icons Gallery are all scientifically accurate and very beautiful, with clean and modern design. For sure will elevate your work value.
How to use Mind the Graph to create my Springer?
Create an account if you don’t have one yet.
It is very easy to create an account in Mind the Graph. We have a free plan with limited features and watermarked illustrations.
If you choose to be a free user we will not request any credit card or payment information and you can be a free user as long as you want.

I recommend you to start as a free user to give it a try and then subscribe to enjoy all the features and create a very professional graphical abstract.
Go to ‘My Creations’ section and start a new one or choose a template.
My creations page is where all your creations are organized and displayed. Click on one of them to edit or start a new one.
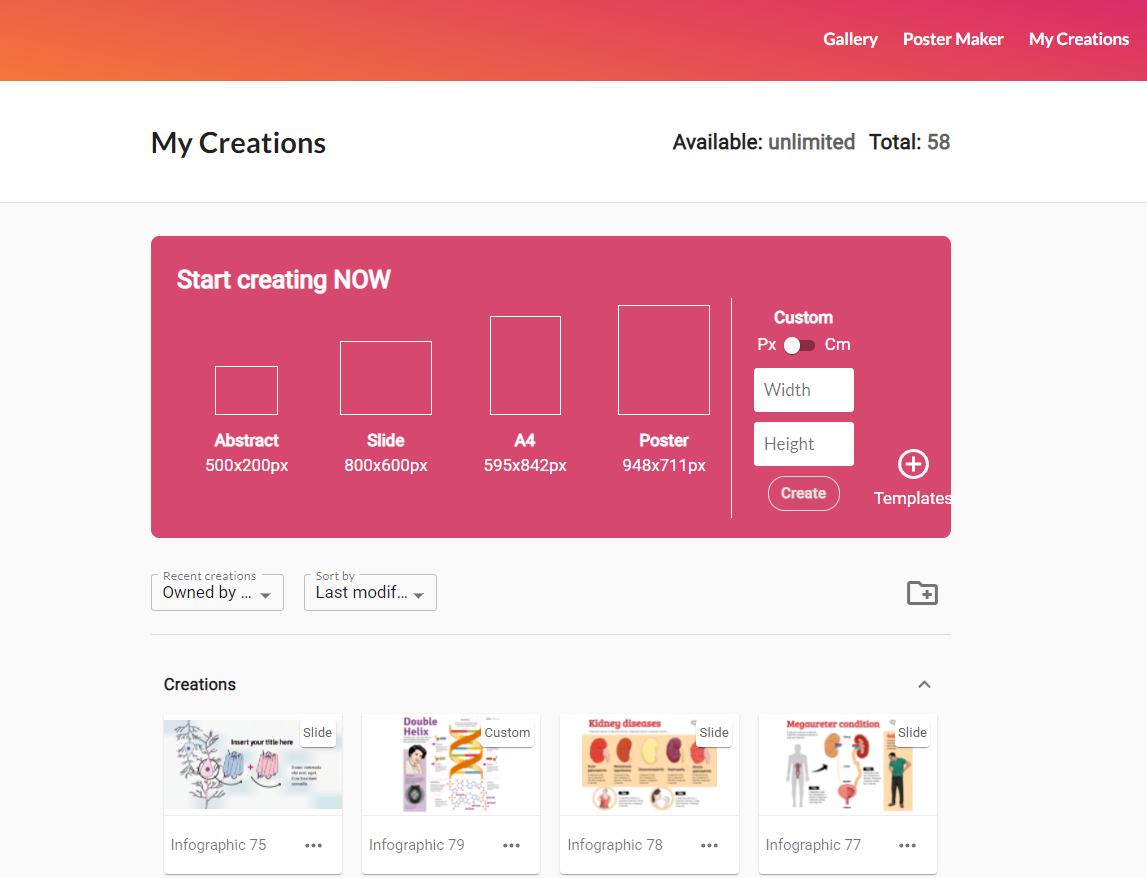
Important: If you are a subscriber, you do not need to start from a blank canvas. Go to our gallery and choose your favorite template.
Set the canva size to the Springer.
The ratio of the width to the height is two to one: 500x250px
Click Here to start using Mind the Graph, the Graphical Abstract Maker
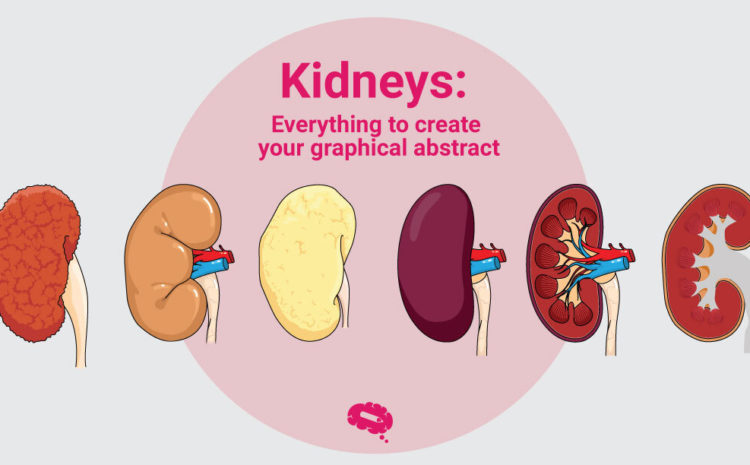
Look for illustrations of your field of work.
We have a huge scientific illustration library available. Search by the name or category of illustrations related to your field of work and choose the best for you.
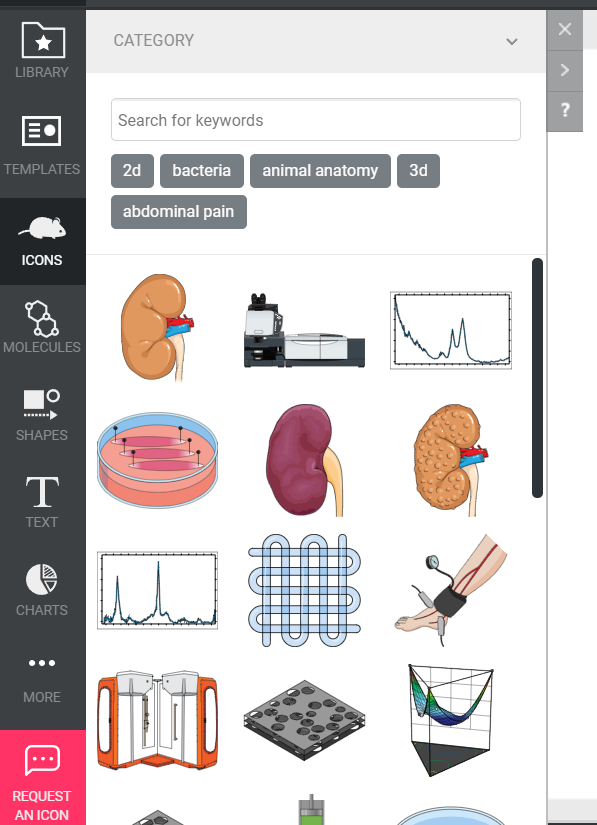
Important: If you don’t find the illustration you need, don’t worry. Subscribers can request new illustrations at no extra cost.
Combine the elements to create a story.
All illustrations from Mind the Graph have a design pattern so you can mix them and have a harmonic creation.
Add text, upload an image and change the background.
Try different colors, fonts and change the size of the elements to see possible arrangements. You can also upload photography or an image of a chart to complete your graphical abstract.
We work to turn this process easy, intuitive, and fun. Check out our tutorial video with step-by-step of the creation process:
Are you ready to try it?
Click Here to start using Mind the Graph, the Graphical Abstract Maker


Subscribe to our newsletter
Exclusive high quality content about effective visual
communication in science.
