
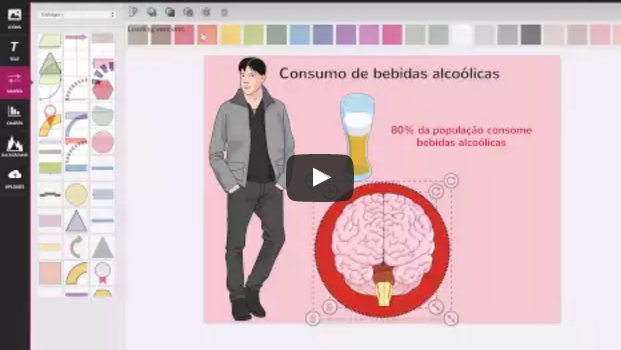
Sometimes, I receive e-mails from scientists, engineers, teachers and other professionals saying: Oh, I love Mind the Graph, but is only for life scientists. Indeed, this is a common mistake. Initially, we focused on biological and medical illustrations, but we are growing and we want to empower scientists to create infographics, beyond the life sciences. Mind the Graph is an online infographic maker for all scientists.
Therefore, we’ve add many illustrations of engineering, agriculture, astronomy, agronomy, geology, geography, human sciences, computer sciences, archeology, physics and more. Take a look at this selection of new illustrations:

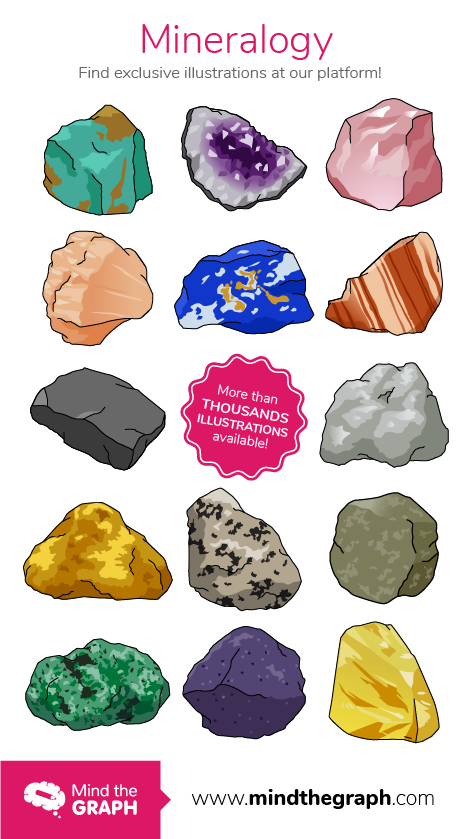
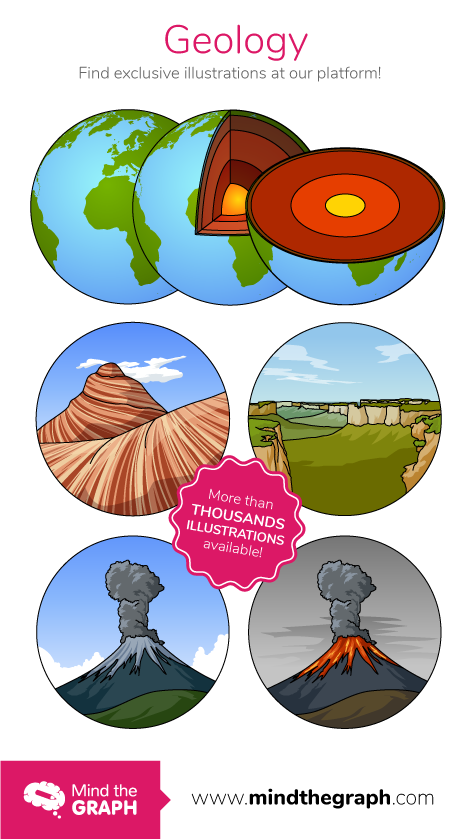
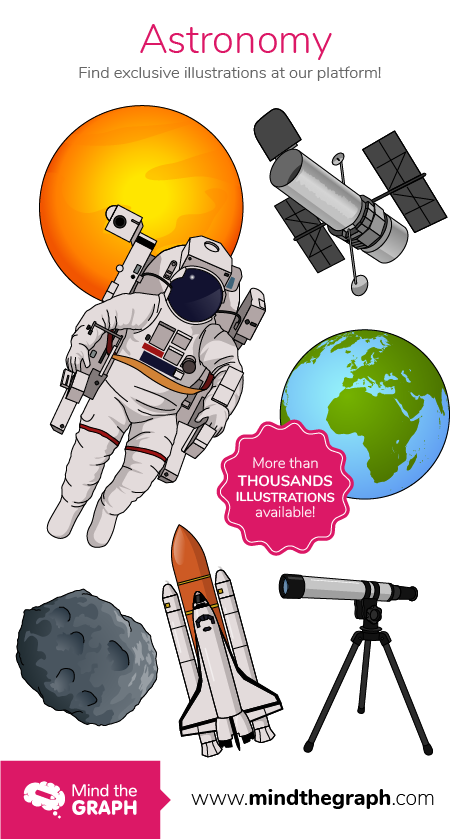

Do you want more illustrations of your scientific field? Yes, you can.
Mind the Graph: An infographic maker for scientists. All scientific fields included.
In addition, we create new illustrations on demand. Which means, subscribers can request new illustrations that become available few days after the request. If you think your field needs more illustrations, just write to us contact@mindthegraph.com
Also, feel free to contact us to send your feedback. What is your scientific field? What illustrations are you missing? Do you have a favorite illustration? We want to hear from you.


Subscribe to our newsletter
Exclusive high quality content about effective visual
communication in science.
