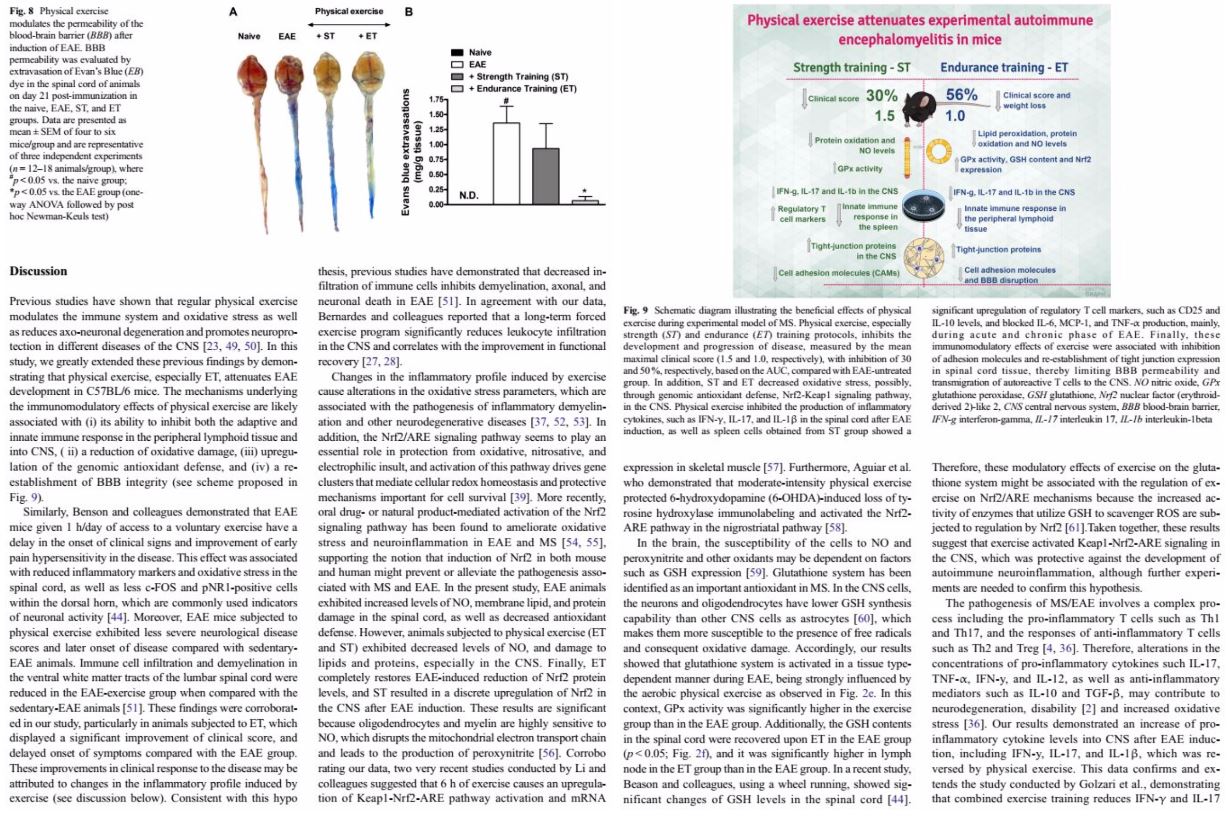
All scientific papers look the same when piled up. If you want to get published, you need to make your research catch everyone’s attention. You need to do something different.
Scientific journals often have many detailed rules on how to fit a paper to an especific format. However, you don’t need to break the journal rules in order to get their attention.
Where do I start?
One of the first things we do when starting to read a paper is to look for figures and graphs. We try to take as much information as we can from fast sources of data. This behaviour is not always conscious. It is a simple attempt to save time by understanding faster what something is about.
That means we usually have only a few seconds to convince someone that our work is worth reading. If figures and graphs are what catches the readers attention, than let’s work on them a little bit harder!
Want to see if it works?
One of our Premium user, Dr. Rafael Dutra, recently published a paper entitled “Physical exercise attenuates experimental Autoimmune Encephalomyelitis by inhibiting Peripheral Immune response and Blood-Brain Barrier Disruption”.
It is no surprise to say that this paper is a little bit complex and scientists outside the Immunology field could find it a bit difficult to comprehend. Well, this paper could be as bright and relevant as many others and still go unnoticed.
However, this paper contains something hard to ignore when browsing for relevant information: a graphical abstract.
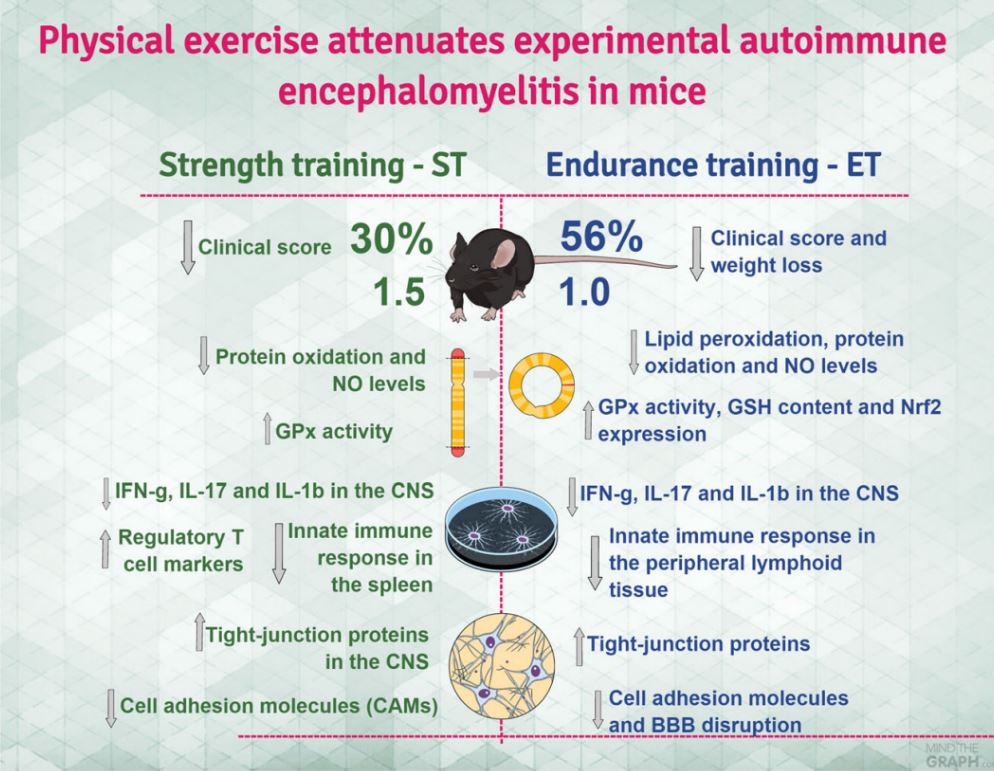
What is a graphical abstract?
A graphical abstract is a visual way to present the main and most relevant information of your work. If the reader is short on time and needs an easy way to see if your work is relevant or not for she or he, they will look for a graphical abstract.
In addition, a graphical abstract shows the domain you have on your research. Being able to summup all your findings in a logical and visual way is highly appreciated. Can you imagine how impressed you can get any revisor?
Ok, you got me. I want to get published!
There are many tools to make graphical abstracts or scientific infographics. The graphical abstract herein presented was made using Mind the Graph platform. We have a Free version in which you can give it a try and access our scientific library. Premium users, have full access to the platform and special benefits as you can see here.
Are you ready to get published and cited?


Subscribe to our newsletter
Exclusive high quality content about effective visual
communication in science.
